
Estimated reading time: ~15 min.
A wise man once told me: “Never recommend a stock to anyone. You’re bound to loose. If it rises, they’re brilliant. If it tumbles, you’re an idiot.” In length, I emphasize that the following write-up is not a recommendation. It’s merely a collection of reflections that document my reasoning behind my investment decisions, hence allowing me to go back and learn from my mistakes and successes.
Abstract
- The market for construction, development and sales of residential properties in the United Kingdom has boomed during the last 5 years. This fact is evident in seven stocks’ per annum growth rates. Yet, all of them are trading at P/E and P/CF multiples of 12 or below. Why? A series of macro trends are discussed.
- Yours truly concludes: Mr. Market must be anticipating that the latest cycle’s tailwind will wade, which a handful of factors do indeed suggest. However, the UK has a housing problem, and the demand for properties is currently exceeding the supply. Furthermore, the government is extending a helping hand to increase the construction of new homes, hence suggesting that the market is not satisfied.
- These political hand-outs are especially beneficial for lower and middle class families as well as first time buyers. For said reasons, developers with a focus on the lower end of the housing segment seems to be favored. Having dived into a handful of developers, Persimmon PLC (PSN) is deemed an interesting candidate.
- Mr. Market currently values Persimmon – which has grown its free cash flows at 35% on average the last 5 years and 18% i 2017 – as being a zero growth business. A (in my opinion!) conservative intrinsic value assessment suggests a value of £42.5-52.4 – 50-84% above the current stock price of £28,50.
- The industry is cyclical, which entails a series of risk.
Today’s post is a bit different than my previous stock analyses. Rather than diving straight into a single stock, I will try to outline why there might be bargains in a given sector. Afterwards I’ll pick out a few candidates based on macro trends before finally narrowing down on a single stock.
Background
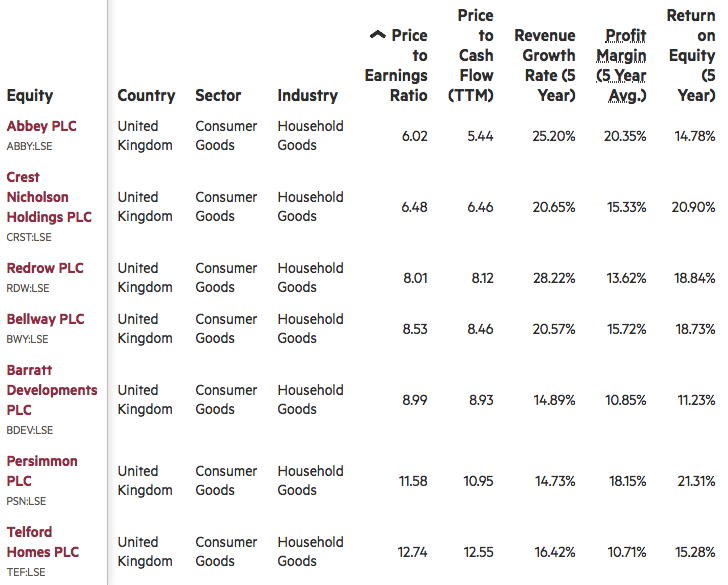
I recently set up a screen that filtered stocks based on P/E and P/CF ratios of <15, a >10% net margin, >15% ROE as well as a positive revenue and earnings growth the past 5 years. Based on the 112 results there were no less than seven stocks within the sphere of housing development in the United kingdom. Based on the numbers they were all high-quality growth businesses at what appeared to be bargain prices, cf. table below.
As mentioned, I got the sense that there was unappreciated value in this sphere. Yet, the sceptic must ask: How come the market is keeping the prices of these apparently high-growth businesses down?
Why so depressed, Mr. Market?
One should be on guard when there appears to be gold in the street, but no competing gatherers. What do they know that I don’t? My immediate concern is, of course, that there seems to be finit amount of citizens in the United Kingdom, and now that these businesses have experienced 15-28% growth rates, is the market saturated?
I needed to answer said question. To address it, however, I had to find out what drives the housing market in general, but more importantly the development of new homes. Having researched the ins and outs of the housing market a bit, it seems these are the most important factors:
- Interest levels and access to capital (ease of lending)
- Political conditions and initiatives
- General debt levels
- Income growth
- Demographical tendencies
This list makes intuitive sense, as they center around the fundamental driver, namely whether or not the brits can afford to move into the homes that our above-mentioned seven developers and other suppliers construct.
With the benefit of hindsight, it’s easy to account for the latest cycle. The low interest level has, of course, provided a lot of tailwind in the developers’ sails. In addition, the political programme Help to Buy, where first-time buyers received aid for the down payment from the government, accelerated borrowing and thus construction. Between 2010 and 2013, household incomes fell by 4.5%, but then grew by 11.6% towards 2017, which translates into a average increase in income of ~2%. The combination of, however measly, income increases, easy access to capital as well as political handouts have driven house prices north at a rate of 4% per annum since the financial crisis, cf. below chart from Tradingeconomics.com:

Higher housing prices is a godsend for developers, as their units can be sold at higher prices, but the properties aren’t noticeably more expensive to construct. This combination has resulted in high margins, as the table above illustrated.
The developers – and shareholders alike – have, in other words, been favored in the past cycle. How come, then, that these stocks are trading at single-digit P/E ratios? They are even trading at low P/E multiples without a decrease in share prices. They simply seem cheap, and has been so in the entire upturn with average P/E ratios of 10-12.
We can make some qualified guesses as to what is keeping Mr. Market’s optimism in check. According to BBC, the brits’ household expenses are currently exceeding their income, which means citizens are financing their spending from their savings or borrowed money. BBC also mentions that the devaluation of the Pound Sterling puts pressure on the purchasing power and income level. The Guardian states that the British household debt level has reached the same heights we saw before the 2007 crisis. In length, the paper says arrears on electricity, water and heat has increased with 12% during the past five years, indicating the brits are living beyond their means. In other words: an array of red flags. Finally, housing prices fell 3.1% in april, which provokes the question: Is this the beginning of a larger downturn? It could be. Yet, there are some positives too.
However, wages are in an uptrend and unemployment is record low. In addition, the government continues to be pro-construction, as the good men and women within Palace of Westminster had an ambition to build 300,000 new homes in 2017, 83,000 more than the 217,000 that actually got constructed. In length, this report concludes that developers haven’t been able to meet the demand. Combined with another report’s projection that there is a need for the construction of 210,000 homes annually from now until 2039, indicates a favorable supply-demand dynamic.The government is motivated to address this need, which is evident in its Housing White Paper, which outlines how the housing market should be reformed in way that boosts the construction of new homes. The plan included a reduction of the stamp duty in November 2017 so first-time buyers would be enticed to enter the housing market. In addition, the government promised to allocate an additional £10 billion to aforementioned Help to Buy programme.
What am I trying to say with this lengthy – yet superficial – outline of macro conditions? Well, I believe that Team Pessimist’s arguments are indeed real and somewhat terrifying. Yet, in my view, the most important aspect is still in the developers’ favor: the market is not saturated. Quite the contrary. The demand for newly built homes exceeds the demand – developers can’t keep up! Combined with a willing government’s handouts, the market seems to be lucrative and relatively well-protected. Another, and perhaps more important conclusion, centers around the ‘type’ of aspiring homeowners who will benefit from Westminster’s political initiatives. The government supports the construction of housing for the middle and lower class as well as first-time buyers. The prime minister says on pages 5-6 of aforementioned white paper: “The fact is that housing is increasingly unaffordable – particularly for ordinary working class people who are struggling to get by. […] The starting point is to build more homes […] so that more ordinary working families can afford to buy a home.”
In short, I believe (or hope) that developers with a focus on the low-income segment can fill the order books despite record high house prices and buoyant debt levels without margins being squeezed too much if the feared recession is realized, since affordable housing has (according to Theresa May) to be built to house Britain’s middle and middle class.
Narrowing the field of candidates
One option is to bet on the sector as a whole. The companies are growing in what appears to be a favorable environment, and they are offered at seemingly attractive prices. Picking a few stocks may thus be naïve. Yet, that’s exactly what I am, so I will try to follow my theory all the way to the finish line.
In length of my thesis in the previous section, companies that do not focus on the low income segment should be discarded. I want to bet on the developers who are most likely to benefit from political support. I tried to find an exact definition of “affordable housing”, but the government’s What is affordable housing? report is avid in the area. Consensus in the media, however, seems to be homes under ~£250,000. I therefore read the annual reports of the seven companies above, and listed the average prices per unit:
- Telford Homes PLC: £527.000 (p. 8 of the annual report)
- Crest Nicholson Holdings PLC: £388.000 (p. 9 of the annual report)
- Abbey PLC: £336.075 (p. 1 of the quarterly update)
- Redrow PLC: £309.800 (p. 22 of the annual report)
- Barratt Developments PLC: £275.200 (p. 12 of the annual report)
- Bellway PLC: £260.354 (p. 22 of the annual report)
- Persimmon PLC: £213.321 (p. 4 of the annual report)
The three companies that more or less match my thesis are hence the market leader, Barratt Developments PLC (BDEV) with £4.82 billion in revenue, and the two market followers, Bellway PLC (BWY) and Persimmon PLC (PNS) with £2.73 billion and £3.42 billion in revenue, respectively. This trio constitutes the field of interesting candidates. Let’s go through the books to assess whether a mismatch between price and value should be present.
What do you expect, Mr. Market?
The most widely used valuation model goes under the banner discounted cash flow (DCF) analysis. The method is outlined in the post How much is LEGO worth?, but let me flesh it out quickly.
You may have heard Warren Buffet say: “Intrinsic value can be defined simply: It is the discounted value of the cash that can be taken out of a business during its remaining life.” A DCF calculation aims to determine just that. The model seeks to estimate a company’s present value based on the future free cash flows of the business (into perpetuity). In essence, free cash flow (FCF) is the profits that are left after spending the money needed to maintain the operational assets (e.g. property, plant and equipment). Hence, the free cash flow is simply operating cash flow – capital expenditures. FCF is significant, as it represents 1) the cash you could pocket if you owned the entire business, and/or 2) the cash the company can allocate as it sees fit, e.g. reinvest in the business’ growth, pay dividends or share buyback programs. Once we’ve made our projections as to the growth rate of these free cash flows, we need to settle on an appropriate discount rate based on the investment’s risks. Finally, we subtract the business’ long-term liabilities and add its cash position.
For this initial exercise, I do not want to estimate each business’ intrinsic value. I would rather follow Stephan Penman’s advice from Accounting for Value: “Valuation is not a game against nature, but a game against other investors, and one proceeds by first understanding how other investors think. […] Maintain the attitude that you are not calculating “intrinsic value” but rather challenging the market price. The onus is to […] accept or dismiss the market price.” (p. 80 & 146)
We should, in other words, make a reversed DCF calculation to uncover the growth rates that are “baked in” to today’s prices. If we apply a generic discount rate of 12.5% and a perpetuity growth rate of 3% (this is the rate we assume the company will grow at forever in the terminal period; generally one shouldn’t assume a business can outgrow the economy’s historic rate of 3%), Mr. Market seems to expect BDEV and BWY will grow its free cash flow by 10.5% and 19%, respectively, over the next 6 years. Mr. Market has a lot more modest expectations for PNS, namely 0.75%.
Despite Mr. Market expects BDEV and BWY to grow at a double-digit pace, it is certainly not utopian considering their historical growth of free cash flows:
| Year | PNS | BDEV | BWY |
| 2012 | £177,400 | £147,300 | (£27,686) |
| 2013 | £235,000 | £163,800 | £57,194 |
| 2014 | £388,700 | £237,600 | £72,921 |
| 2015 | £483,300 | £178,600 | £24,035 |
| 2016 | £683,500 | £646,800 | £159,320 |
| 2017 | £806,000 | £384,600 | £151,000 |
| Per annum | 35.36% | 21.16% | 27.47% |
It is striking that the developer Mr. Market has the least faith in is the company with the highest historical growth in free cash flows! It could indicate that this nugget is an unappreciated gem. Let’s dig deeper to assess whether this might be a bargain.
Persimmon PLC (PNS): Double-digit growth story at a zero-growth price
With a stock price of £28.50, the market value of PNS is £8.75 billion. Revenues of £3.42 billion and a market share of ~ 10% ensures Persimmon a position as market follower (i.e. one of the challengers to the market leader, BDEV). Persimmon constructed 16,043 new homes in 2017 with an average price of £213,321. This average is the sum of its three brands’ total sales: Persimmon with 11,489 homes of £215,336 on average, Charles Church’s 1,785 homes of £351,218 as well as Westbury Partnerships’ 2,769 homes of £116,068. As outlined above, Persimmon is one of few suppliers in the lower end of the price range.
Persimmon launched a strategy in 2012. The initiatives and results of said strategy are outlined on page 18-23 of the 2017 annual report. It is packed with promises and glamorous words, but instead of highlighting these, I would rather let the results do the talking. The company’s strategy and niche focus seems to have borne fruit, cf. the following table of Persimmon’s 2017 results and an average or annual growth rate for the past 5 years:
| Parameter | 2017 or TTM | 5-year avg. |
| Revenue Growth | 8.92% | 14.73% |
| Income Growth | 25.84% | 36.26%% |
| Free Cash Flow Growth | 17.92% | 35.36% |
| ROA | 17.68% | 13.21% |
| ROE | 26.50% | 20.49% |
| ROI | 26.20% | 19.63% |
| Net Margin | 22.99% | 16.84% |
| Dividend Yield | 8.25% | 3.40% |
It is difficult for yours truly not to be impressed by the above performance. With these growth and profitability figures, Persimmon should be bathing in cash – and it is! From 2016 to 2017 alone, the company increased its cash position by 43%, from £913 million to £1.3 billion. In addition, all debt is paid, which is why Persimmon’s long-term debt amounts to measly £356 million. Generally speaking, it is a beautiful balance sheet with £3 billion in net assets.
That Persimmon bathes in cash is clearly evident in its Capital Return Plan. In 2012, management swore to return about £6 per share between 2012-2021. They have just increased that amount to £13, of which £6 has already been paid (shareholders can thus expect to receive £7 in dividends during the next 3 years). At a price of £28.5, this is not too bad – especially if the company continues to increase its cash position by £1.25 per share annually in the future, which it has done in recent years!
I admit that it sounds too good to be true: a debt-free, two-digit growth story with splendid margins, a shareholder-friendly management team that targets a customer group who enjoys political support, on the market for a P/E and P/CF around ~11. It is, nevertheless, the snapshot I see.
But what is the business worth? Since the company is virtually debt free, the discount rate is easy to determine. We do not have to calculate an average cost of capital (WACC) based on the division and cost of debt vs. equity, but simply determine a required rate of return based on the investment’s risk. In my view, 12.5% is appropriate (since I ‘require’ this return as compensation to take on the risk associated with this stock).
Growth rates are, however, more difficult to determine. Note that this is more or less a guessing game, but one approach could be to start with the current year’s growth rate and then downgrade it by one-sixth each year before the perpetuity growth rate of 3% kicks in, cf. below:
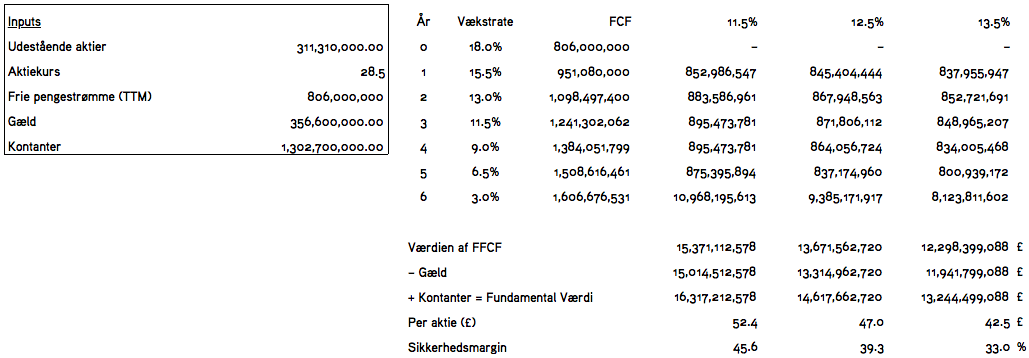
If one believes the narrative behind these assumptions, the model suggests an intrinsic value estimate of £42.5–52.4 depending on the discount rate (11.5% and 13.5%). These estimates are 50-84% above the current price tag of £28.5. Only time will tell whether these estimates are too optimistic or conservative. But one thing seems certain in my view: Mr. Market’s zero-growth expectations for the stock seem to be too pessimistic. In length, I tend to believe Persimmon is undervalued at current levels – even with far less optimistic assumptions than the above.
Risks
An array of risks are discussed in the macro review above. Yes, a recession will surely hurt and undoubtedly hit this industry more than less cyclical businesses. Yet, if you believe Theresa May’s must-and-shall thesis regarding new homes in Britain, Persimmon seems like a more well-protected developer thanks to the above-mentioned political support.
In addition, the uncertainty regarding Brexit’s influence on the country’s economy is worth mentioning. If the government goes back on its promise to help Persimmon’s potential customer group (including the Help to Buy program), this will obviously handicap these aspiring homeowners’ chances of someday seeing their name on a deed. Interest rate rises, reduced credit availability, increases in material prices, legislation regarding wage increases for blue collar workers etc. are also worth highlighting. However, this post is beginning to get quite lengthy, so the reader is referred to p. 23-27 of the 2017 annual report where such risks are outlined.
Conclusion
As mentioned, this analysis is less structured than usually, see e.g. my analyses of McKesson Corp. (MCK) and RCI Hospitality Holdings Inc. (RICK), where the business, the stock, an intrinsic value assessment, management and risks are covered in their own sections. This post was more ‘ad hoc’, so I hope the following recap proves helpful:
- Though it seems like the past cycle’s tailwind is winding down a bit, the British government has shown that it is motivated to solve the country’s housing problem through various initiatives. Initiatives, which Persimmon is particularly well-positioned to benefit from because of its focus on the low-income segment (lower and middle class families and first-time buyers).
- Home developers can currently not meet the demand, which creates an attractive supply-demand dynamic. In addition, independent reports estimate that by 2039 there is a need for 210,000 new homes per year, which – in theory – should ensure Persimmon abundant potential in the following decades. However, the investor must be aware that a recession is a wildcard that could force a cyclical business like Persimmon to its knees.
- Mr. Market is currently pricing Persimmon – which has grown its free cash flows at 35% per annum over the last 5 years and 18% in 2017 – as a zero-growth company. A (in my view!) conservative intrinsic value assessment proposes a span of £42.5-52.4 – 50-84% above the current price of £28.50.
- The management team is shareholder friendly, evident in its Capital Return Plan, which circulates around the distribution of the £1.3 billion that sits on the balance sheet – a cash position that the company has increased by 59% per annum during the last 4 years.
To repeat a sentence from above: A debt-free, two-digit growth story with splendid margins, a shareholder-friendly management team that targets a customer group who enjoys political support, is offered on the market for a P/E and P/CF around ~11. There are all sorts of risks, and the stock is indeed cyclical, but due to the wide margin of safety, I have pulled the trigger on Persimmon.
One thought on “Stock Analysis of Persimmon PLC (PNS): Double-digit growth story at a zero-growth price”