Abstract
- 150,314,660,000 DKK. 150 billion Danish krone, or $23,8 billion. That’s the present value of LEGO’s estimated future free cash flows, and thus my take on LEGO’s intrinsic value. If we assume 150 billion is a somewhat accurate estimate, that corresponds to a P/E of 16, a P/BV of 7.5 and a P/S of 3.9.
- Would you buy shares in LEGO if it was a publicly traded company? I believe Warren Buffett would, as this business is right up his alley; a cash-cow without any debt and a strong moat that protects it from competitor’s attacks and ensures high margins as well as fabulous returns on capital (ROE of 49.9% and ROIC of 90.5% in 2016).
Arh, LEGO. Those magical small bricks that allow children to live out their imaginations one creation at a time. It was undoubtedly my toy of choice growing up. The birthday and Christmas wishlists were nothing but LEGO boxes. Apparently, I wasn’t the only kid in love with this great product idea.
In the previous 10 years, LEGO has grown its revenues from 7,823 mio. DKK (or $1,241 mio.) in 2006 to 37,934 mio. DKK (or $6,021 mio. DKK) in 2016 (cf. annual reports). That’s an average annual increase of just above 17%. Now, that’s a growth story. LEGO is a privately owned business, so the stock market hasn’t been able to put a price tag on this growth story. Yet, some analysts have tried to value it, ranging from 114 billion (or $18 billion) to 220 billion DKK (or $34,9 billion). That’s quite a span, so I thought I would give my two cents to this debate for practice purposes.
The returning readers of this blog know that I usually employ the valuation method outlined in Why are we so clueless about the stock market?, which I perhaps have wrongly referred to as a a DCF-analysis in the past in lack of a better label (since I usually focus on earnings, not free cash flow, based on what I learned in Accounting for Value). Going forward, however, I’ll probably employ a ‘real’ DCF-analysis in collaboration with aforementioned book’s to get a more nuanced picture of the businesses in question. Enough chit-chat, let’s get to it!
Introducing Discounted Cash Flow (DCF) model
Allright, I’ll introduce the DCF model rather quickly, since the web is packed with great resources to master this method. You may have heard Warren Buffet say: “Intrinsic value can be defined simply: It is the discounted value of the cash that can be taken out of a business during its remaining life.” Now, a DCF analysis aims to determine just that. The model seeks to estimate a company’s present value based on the future free cash flows of the business (into perpetuity).
In essence, free cash flow (FCF) is the amount that is left after spending the money needed to maintain the operational assets (e.g. property, plant and equipment). Hence, the free cash flow is simply operating cash flow – capital expenditures. FCF is significant, as it represents 1) the cash you could pocket if you owned the entire business, and/or 2) the cash the company can allocate as it sees fit, e.g. reinvest in the business’ growth, pay dividends or share buyback programs.
Now, how do we determine the sum of a business’ cash flows for its remaining life? There are four variables we need to address in order to get the model running (though more complex models that apply other variables, i.e. beta, exist):
- The initial free cash flow
- The near-term growth rate of free cash flows
- The terminal growth rate of free cash flows
- An appropriate discount rate based on WACC
Allright, the first one is easy. We simply find the latest annual report and determine our ‘base rate free cash flow’. In regards to the second bullet point, we are imposed with the rather ungrateful task of estimating how the cash flow will grow in the near term based on current outlooks, recent company actions, industry/market challenges etc. Thirdly, we are to determine a rate at which the cash flows will grow into perpetuity. Generally, a rate of 3% will be a somewhat ‘safe bet’, as that’s what the overall economy has historically been growing at, and few businesses are able to beat that into perpetuity.
The last point requires a bit more elaboration though. You’re welcome to read the summary of Why are we so clueless about the stock market? and Find the Best Stocks for a more thorough exposition of the term. In short, however, the discount rate is the cost of tying up capital in any asset. Some analysts use a flat discount rate, e.g. 10%. Others, however, address it a bit more ‘scientifically’ by determining the weighted average cost of capital (WACC). Any business is funded by one or both of two ways: 1) through shareholders’ equity, and/or 2) through credit (debt). In terms of the former, the risk free rate in Denmark is currently 2.5% (the yield of the 30-year government bond). Add a risk premium of e.g. 5% (which I speculate is what’s available to investors by tying up capital in alternative investments), and you arrive at a rate of 7.5%. That’s the return shareholders would expect to gain, and is thus the cost of equity. For the latter, you could probably investigate it more thoroughly, but I usually do the lazy deed and use a rate based on the otherwise going interest rates in society, e.g. 3-5% to make a somewhat conservative guess. Next, you should look at the business’ capital structure, i.e. how’s the split between debt and equity. For illustration purposes, let’s assume that the business is funded in a 50-50 manner. Using these variables, we arrive at a WACC of 6.25% based on the following calculations:
- Cost of debt: 5% x 50% = 2.5%
- Cost of equity: 7.5% x 50% = 3.75%
- WACC: 2.5% + 3.75% = 6.25%
I’m aware that this walk-through was quick and dirty. If elaboration is needed, please stop by aforementioned book summaries or search the web, as there’s a heap of information about this topic. Perhaps it’ll be a bit clearer when we apply the model to LEGO in the following section.
Determining LEGO’s intrinsic value
To get us started, let’s take a look at LEGO’s historical free cash flows. Now, if you think the revenues growth was impressive, wait till you gaze at the below table. LEGO is a cash cow in the truest sense of the word with an average annual increase in free cash flows of 24.5%.
| Year | Operating Cash flow |
Capital Expenditures |
Free Cash Flow |
| 2006 | 996 | 316 | 680 |
| 2007 | 1,033 | 399 | 634 |
| 2008 | 1,954 | 368 | 1,586 |
| 2009 | 2,655 | 1,258 | 1,415 |
| 2010 | 3,744 | 1,200 | 2,544 |
| 2011 | 3,828 | 1,580 | 2,248 |
| 2012 | 6,220 | 1,790 | 4,430 |
| 2013 | 6,744 | 2,747 | 3,997 |
| 2014 | 7,945 | 3,174 | 4,771 |
| 2015 | 10,559 | 2,948 | 7,611 |
| 2016 | 9,084 | 3,000 | 6,084 |
Note that from 2009 and forth, ‘Investments in intangible assets’ appears in the annual reports. These are included in the CAPEX figures. All numbers are in millions (DKK).
The above table helps us determine and estimate three of the four bullet points presented earlier. The initial free cash flow is easy-peasy, that’s 6,084 DKK.
Now, for the near-term growth rates we need to begin Operation Guesswork. As evident from above table, the free cash flow plummeted 20% from 2015 to 2016. It’s no secret that LEGO has faced slight headwinds lately, i.e. single-digit revenue growth and declining earnings, which has led to a round of layoffs. We don’t know how these factors have affected 2017’s FCF, so the analyst must estimate (or guess, if you will). We know that 2017’s operating profits have fallen 6%, so let’s assume that operating cash flows will follow suit: 9,084 / 1,06 = 8,569 DKK. Let’s assume that management has begun cost-cutting initiatives, so CAPEX only increases by 15% rather than the historic 25%: 3,000 x 1,15 = 3,450 DKK. Subtracting the two streams gives us a FCF of 5,119 DKK (8,569 – 3450 = 5,119). That translates into a 16% decline in FCF from 2016 to 2017: ((6084 – 5119) / 6084) x 100 = 15.86%.
As you may agree, the assumptions for 2017 is somewhat substantiated. From here, however, it becomes a true guessing game. We know that 8% of the workforce has been dismissed, so let’s guess that the 2017’s operating profits increase with the same amount (I said guess, didn’t I?), and we have operating profits of 9,254 DKK (8,569 x 1,08 = 9,254). Let’s assume that CAPEX continues to rise with 15% (I confess, this number is pulled out of thin air), and we arrive at 3,967.5 DKK (3,450 x 1,15 = 3,967.5). In terms of FCF, it translates into 5,286.5 DKK – a 3,27% increase from 2017.
Moving ahead, in the name of ‘cutting corners’, let’s simply assume LEGO’s FCF grows alongside the toy market’s average growth rate of 5% until 2022. From here and to perpetuity, I’ll assume LEGO is able to grow its FCF with 4%, one percent more than the economy as a whole. Why? In my humble opinion, LEGO is a truly outstanding cash cow with a valuable brand and a universally appealing product idea. Now, that’s a moat, which I believe merits an above-average growth rate.
The last matter we need to settle before we’ll get the model humming, is the discount rate. In an all-equity business (i.e. without any debt), this task is easy. We just need to settle on a cost of equity, which I believe is 7.5% at the time of writing.
Ready? Let’s populate the DCF model with these numbers!
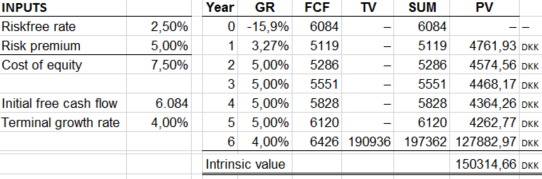
150,314,660,000 DKK. 150 billion Danish krone, or $23,8 billion. That’s the present value of LEGO’s estimated future free cash flows, and thus my take on LEGO’s intrinsic value. Now, obviously this is nothing but an assessment from a hobby investor. Please take note of how sensitive the model is, i.e. if I change the terminal growth rate to 3.5% rather than 4%, the intrinsic value is just short of 135 billion DKK instead. Nevertheless, if we assume 150 billion is a somewhat accurate estimate, that corresponds to a P/E of 16, a P/BV of 7.5 and a P/S of 3.9.
Would you join the owner circle of LEGO at that valuation? I sure would, but I’m also a true LEGO-fanatic who would buy-and-hold forever, no doubt. I believe Warren Buffett would too, as this business is right up his alley; a cash-cow without any debt and a strong moat that protects it from competitor’s attacks and ensures high margins as well as fabulous returns on capital (ROE of 49.9% and ROIC of 90.5% in 2016).
4 thoughts on “How much is LEGO worth? A discounted cash flow experiment”