
A wise man once told me: “Never recommend a stock to anyone. You’re bound to loose. If it rises, they’re brilliant. If it tumbles, you’re an idiot.” In length, I emphasize that the following write-up is not a recommendation. It’s merely a collection of reflections that document my reasoning behind my investment decisions, hence allowing me to go back and learn from my mistakes and successes.
[NB! I exited my position in Foot Locker on May 25, 2018 at $53.
Including dividends and currency gains, a 70.12% return was realized in 7 months.]
Abstract
- Foot Locker is an international provider of athletic footwear, apparel and equipment. The stock has plummeted 60% since May 2017, from $77 to $32.
- By applying a Discounted Free Cash Flow (DCF) model and a Discounted Earnings and Dividend model, I assess the intrinsic model of Foot Locker to be in the span of $49-58, hence providing a 35%-45% margin of safety from current levels of $32.
- I arrived at those valuations mainly by predicting a few rough years ahead with negative FCF and EPS growth, followed by a more prosperous period once competition becomes less fierce and Foot Locker is expected to achieve its historic respectable growth rates of around 10%.
In The Most Important Thing, Howard Marks teaches us that the necessary condition for a bargain to surface is that the perception is worse than reality. Now, Foot Locker (FL) has tumbled 60% since May 2017, from a high of $77 to the current level of $32. Let’s double-click on Foot Locker to assess whether the reality is indeed dire, or if Mr. Market has overreacted.
The Business
According to the latest annual report, Foot Locker offers athletic footwear, apparel and sports equipment through its 3.363 stores in 23 countries. Highly regarded and attractive consumer brands such as Nike, Adidas, Puma, Reebok and Under Armour are but an extract of Foot Locker’s shelves.
The Stock
Ultimo October 2017, Foot Locker’s market cap is $3.9 billion with a stock price around $32. The fundamental landscape looks as follows:
- Price/earnings (P/E): 7.2
- Price/book value (P/BV): 1.3
- Price/sales (P/S): 0.5
- Return on equity (ROE): 21.1%
- Return on invested capital (ROIC): 20.15%
- Gross and net profit: 32.9% / 7.49%
On the surface, it surely looks cheap. A low-debt, high return on capital (ROE and ROIC of +20%) business at what appears to be attractive valuations (low P/E, P/BV and P/S). Let’s explore what transpired that led to these low fundamentals, and the beating that FL has received.
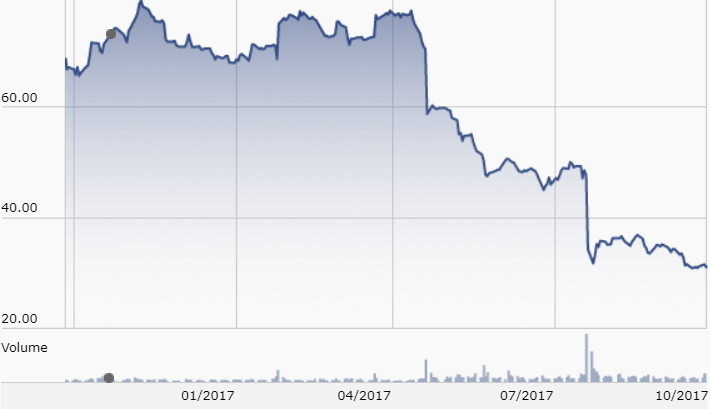
As you may know from my analyses of Sports Direct (SPD) and Buckle Inc. (BKE), the retail sector has been facing massive headwinds the last few years. Multiple experts state that the apparel industry is suffering from overcapacity, which in and of itself causes pricing pressure. Add Amazon’s fierce price-based competition and the “death of brick and mortar stores”-narrative into the mix, then you know why margins are getting squeezed and stock prices are crushed. Let’s not forget that popular brands such as Adidas and Nike are on a quest to move closer to the consumer through own stores and eCommerce efforts as well. In the case of Foot Locker, the fear of being Amazoned was intensified in June 2017 when Foot Locker’s best-selling brand, Nike, made a partnership deal with no other than Amazon (causing the stock price to drop from $48 to $32). Sure enough, the latest quarterly report indicates that both sales, margins and earnings decreased.
Allright, the challenges are undeniable. The business is facing headwinds, and the stock has been beaten up for it. But, has it received too much of a beating? Let’s try to value the business in order to find out. But first, let’s get some insights into Foot Locker’s past performance, as it’ll help us settle on the inputs that go into the valuation models.
Foot Locker’s past performance
To assess the intrinsic value of Foot Locker, I’ll employ two models, 1) the earnings based model taught in Why are we so clueless about the stock market?, and 2) a discounted free cash flow analysis. I won’t introduce the mechanics of these models in this blog post, as it’s described in How much is LEGO worth? and aforementioned book summary. To get those models humming, we’ll need to feed them some variables. To do so, let’s look at how Foot Locker has performed in the last decade across the fundamentals we’ll employ in the models.
| Year | FCF | EPS | Dividends |
| 2008 | 135 | 0.29 | 0.50 |
| 2009 | 237 | -0.52 | 0.60 |
| 2010 | 256 | 0.30 | 0.60 |
| 2011 | 229 | 1.07 | 0.60 |
| 2012 | 345 | 1.80 | 0.66 |
| 2013 | 253 | 2.58 | 0.72 |
| 2014 | 324 | 2.85 | 0.80 |
| 2015 | 522 | 3.56 | 0.88 |
| 2016 | 517 | 3.84 | 1 |
| 2017 | 550 | 4.91 | 1.10 |
| TTM | 397 | 4.32 | 1.17 |
These models are highly sensitive, so the intrinsic value estimates vary widely based on the inputs. For both models, I’ll make an array of assumptions. I’ll discuss these briefly following the presentation of the models, but be aware of one fact: it involves a ton of guesswork.
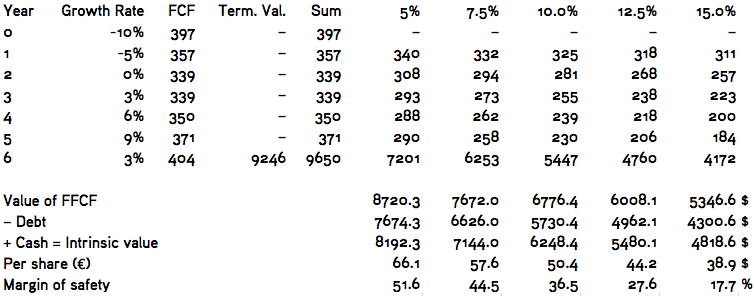
Intrinsic Value, Part I: Discounted Free Cash Flows
Let’s begin with the DCF analysis. The trailing 12 months’ (TTM) free cash flow (FCF) is $397 mio. From this base, we’ll need to estimate (or guess, really) how the FCF will evolve going forward.
Evident from above table, FCF has tumbled in the previous year. Let’s assume that the most devastating blow has been taken, so rather than continuing the steep decline rate, we assume the next year’s growth rate will be -10%. Now, management has announced that it’ll focus on cost reductions, so let’s assume those efforts begin to bare fruit in year 2; we thus apply a still negative, though improving, rate of -5%. From year 2-4, we suppose that the FCF will move around the 10-year average of $342 mio. before improving. During these ‘recovering’ years, we begin to see modest positive growth rates that are slowly moving towards the 10-year average increase in FCF of 11% (a 9% is applied in year 5, just to err a bit on the side of conservatism). Finally, we’ll assume that Foot Locker’s growth rate into perpetuity is 3%, merely following the historical average annual growth of the economy.
Agreed, these inputs seem somewhat arbitrary. Yet, if we plot these inputs into the formula, we arrive at an intrinsic value span of $43 to $70 depending on the discount rate you find appropriate.
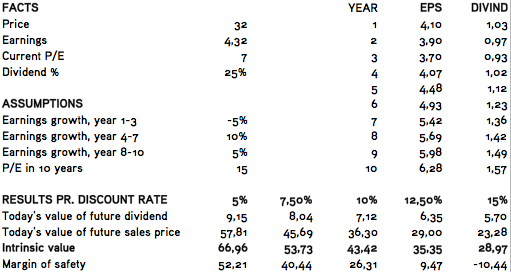
Intrinsic Value, Part II: Discounted Earnings and Dividends
Moving along to the earnings and dividends based model, we’re once again tasked with the ungrateful job of forecasting. In this case, $4.32 is our base (TTM EPS) from which we must try to predict the future. Like with the DCF analysis, I assume the next three years are going to be rough, which is why a -5% earnings growth rate is applied. However, I then assume that management’s cost cutting initiatives and move towards eCommerce starts paying off. During the past 10 years, Foot Locker has grown its earnings at 31% on average; however, it seems a bit optimistic – almost foolish – to hope for such results going forward. I’ll instead use the trailing 5-year average of 10% for this ‘recovery’ phase. Afterwards, I guess the earnings will more or less plateau, growing steadily at 5% a year. Finally, I predict that the historic 25% dividend payout rate will continue, and that the stock is trading at its 10 year P/E average of 15 in 2027. Using all these inputs give us an intrinsic value span of $23 to $67 depending on the discount rate you deem fit.
The Qualitative Aspect: The Narrative Behind the Numbers
As mentioned, the inputs may seem a bit arbitrary. These are but my humble guesses, and they may turn out to be completely misguided, so you should inspect the retail landscape yourself, and come up with your own predictions. However, let me briefly outline why I’ve employed the above numbers.
In both models, I expect a rough sailing towards 2020. As mentioned above, the retail space is extremely competitive with online retailers headed up by Amazon are crushing margins. It’s not unlikely we’ll experience a recession before 2020 given just how ‘expensive’ the markets seem at the moment, cf. my reflection Why I’m hoarding cash and praying for the crash. I suppose some competitors will throw in the towel during these years, but not Foot Locker (I hope!). Its strong financial position will make sure of that. For instance, the company is sitting on $1,050 million in cash, and all its liabilities total ‘just’ $1,130 million.
Hence, once it gets ‘on the other side’, I expect Foot Locker to do quite well in the ‘recovery years’, as I’ve dubbed the 2020-2025 period. I suspect it’ll be able to achieve its historic respectable earnings and FCF growth. Why? First, as implied, the competitive environment will probably be less fierce once the present landscape eliminates competitors (i.e. the second-largest sports retailer, Sports Authority, went bankrupt in 2016, just as Sports Chale did). Second, Foot Locker is by no means a “nobody”. It’s a respected consumer brand that is tantamount with quality athletic goods. The long-lasting relationships with e.g. Nike and Adidas is expected to ensure Foot Locker discount purchases, which in turn enables competitive pricing power or above-average margins.
In short, I believe Foot Locker is well-positioned to ride-out the storm, and come out relatively triumphant on the other side.
Conclusion
To recap, indeed, Foot Locker has been on a rough ride, and there are still many challenges ahead. However, given its strong financial position, qualitative strengths and solid quantitative showing, I believe Mr. Market has been too eager to dump FL shares. As I consider a discount rate between 7.5%-10% appropriate for Foot Locker, we arrive at a valuation of $49-58, hence providing a 35%-45% margin of safety from the current price of $32. Add hereto a EV/EBITDA multiple of 2.77, and I have convinced myself that Foot Locker is undervalued.