A wise man once told me: “Never recommend a stock to anyone. You’re bound to loose. If it rises, they’re brilliant. If it tumbles, you’re an idiot.” In length, I emphasize that the following write-up is not a recommendation. It’s merely a collection of reflections that document my reasoning behind my investment decisions, hence allowing me to go back and learn from my mistakes and successes.
[NB! I exited my position in Rowan Companies on October 8, 2018 at $19.55.
Including dividends and currency gains, a 50.65% return was realized in 12 months.]
Abstract
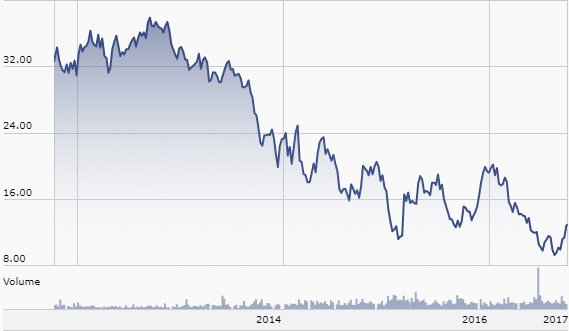
- Rowan Companies is an offshore drilling services provider who lends jack-up rigs and drillships for the exploration of oil and gas. It’s stock has tumbled dramatically from $35 in late 2013 to the current level of $12.50.
- The business’ book value is $42.06 at face value, and $10.74 when adjusted for a worst-case (liquidation) scenario. Hence, if said assessment is correct, there’s only a 15% downside risk from the current level of $12.50.
- Applying Benjamin Graham’s approach whereby the analyst multiplies the company’s normalized earnings with a suitable multiplier results in a valuation of around $20. (Rowan Companies’ 15-year earnings average is $1.98; multiply that with its historic P/E of 10-11, and you get a $19.8-21,78 valuation). Hence, there’s a +60% upside.
- I chose to bet on Rowan Companies rather than the competitors, as its qualitative aspects such as their cost-cutting initiatives and their joint venture with a major player in the industry, who happens to be a customer too (Saudi Aramco), appeal to me. In addition, it’s one of the most attractively priced in the industry with a EV/EBITDA multiple of 5.78.
Rowan Companies PLC (RDC) caught my eye back in July 2017 when the stock traded just below $10. It’s been on quite a rally since with the stock now trading around $12.50. The main reason for this uptrend was its better-than-expected Q2 earnings report. Though its spiked nearly 30% in just a quarter, I still believe there’s plenty of potential in Rowan Companies – and a lot of safety in the balance sheet!
The company
Rowan Companies is an offshore drilling services provider who lends jack-up rigs and drillships for the exploration of oil and gas. Its fleet of 29 units is contracted on a day rate basis to independent operators all over the globe, e.g. the Mexican Gulf, the United Kingdom and the North Sea. The company has a joint venture with Saudi Aramco, one of the world’s leading oil and gas companies, which allows Rowan Companies to operate in the thriving Saudi Arabian market.
The stock
Primo october 2017, the company has a market value of $1.6 billion with a share price of £12.50. The fundamental landscape looks as follows:
- Price/earning (P/E): – (negative EPS)
- Price/book value (P/BV): 0.3
- Debt/equity (D/E): 0.47
- Price/sales (P/S): 1.1
- Gross profit: 50.7%
- Return on equity (ROE): -0.71%
- Return on invested capital (ROIC): 0.67%
As the above picture indicates, the share price of Rowan Companies and the underlying business has taken quite a beating (cf. below graph) alongside virtually all other actors in the troubled oil and gas industry. Naturally, when the prices of crude oil and gas plummet, as has been the case since 2013-2014 (though crude oil prices have experienced quite a upswing since January 2016), the demand for Rowan Companies’ services declines as well. Furthermore, the challenging environment weakens the financial positions of the company’s customers, causing lower day rates and utilization rates. In fact, 44% and 38% of Rowan’s drillships and jack-ups, respectively, are not being contracted according to the latest quarterly update. In length, it’s stated in the annual report that the market is oversupplied (cf. section Current Business Environment on p. 10). The report lists an array of other risk factors that have caused the industry and company’s distress (cf. Appendix B), but the prices and demand for oil and gas is the most significant.
Management recognizes the difficulties. Yet, they appear to stay rather optimistic: “We believe that we are strategically well-positioned to take advantage of the future increases in activity given our strong and stable financial condition, solid operational reputation, modern fleet of high-specification jack-ups and state-of-the art ultra-deepwater drillships and current backlog of $1.7 billion” (p. 10).
Valuation
Exactly the first reason from the above statement, “strong and stable financial condition”, is what caught my interest. In Beating the Street, Peter Lynch explains how “flowers in the desert” can prove to be lucrative investment opportunities. These flowers are good businesses in bad industries (or in cyclical downturns). Peter attempts to find the ‘winner’ in said industries, those with high margins, low costs and strong balance sheets. My assessment of Rowan Companies is exactly this: a financially strong company in a cyclical industry that is bound for an upswing eventually.
Let’s take a look at the balance sheet to assess its financial condition. Afterwards, let’s take a look at how the business has performed in a cyclical upswing to assess its earnings power in such times in order to make a projection of future income.
In Security Analysis, Benjamin Graham taught us that when scrutinizing a balance sheet, one should consider the liabilities at face value, but the assets must be questioned to reflect liquidation value (if the context deems it proper). Hence, one should expect that only 80% of the receivables can be collected; inventories are usually worth 66% of their book value; and fixed assets usually range somewhere between 1-50%. In the case of Rowan Companies, the fixed assets (property, plant and equipment) constitute the majority of the shareholders’ equity. According to the annual report, the rigs, ships and equipment’s salvage value is 10% of cost. As these assets have a lifespan of 25-35 years (cf. annual report), and Rowan e.g. bought four new drillships in 2015, three drillships in 2014, and three jack-up rigs in 2010, it appears we can allow ourselves to stay at least in the mid-range of Ben’s recommendations (33%) by assuming they can be liquidated based on operational values.
Balance sheet as of 30th of June, 2017
| Posting | Book value | Liquidation value |
| Cash and equivalents | $1,145.20 | $1,145.20 |
| Accounts receivable | $310.10 | $248.08 |
| Prepaid expenses | $29.50 | $29.50 |
| Property, plant and equipment | ($9,119.00) | $3,009.27 |
| Depreciated PP&E | $6,901.3 | N/A |
| Other investment/assets | $70 | $70 |
| Total assets | $8,456.10 | $4,502.05 |
| Current liabilities | $297.20 | $297.20 |
| Long term liabilities | $2,848.8 | $2,848.8 |
| Total liabilities | $3,146.00 | $3,146.00 |
| Equity Per share |
5,310.10 $42.06 |
1,356.05 $10.74 |
As there’s 126.24 million shares outstanding, the book value per share is $42.06 at face value, or $10.74 according to my assessment of liquidation value. Remember, the stock price at the time of writing is $12.50. Hence, there is a 15% downside risk according to my assessment of a worst-case scenario.
But what about the upside? Well, that’s more difficult to assess. Usually, I analyze relatively stable businesses with somewhat predictable earnings outlooks, cf. my analyses of Halfords Group (HFD) and Sports Direct (SPD). That’s not very applicable in this case due to the industry’s cyclicality, so what should an analyst do? Well, in lack of a better method, I’ll try to follow Benjamin Graham’s approach whereby the analyst normalizes (smooths out) the earnings based on a decade’s average, which is then multiplied with a suitable multiplier. The average EPS of Rowan Companies over the past 15 years is $1.98. Around this baseline, we see quite wild swings, ranging from -0,93 to $5.83.
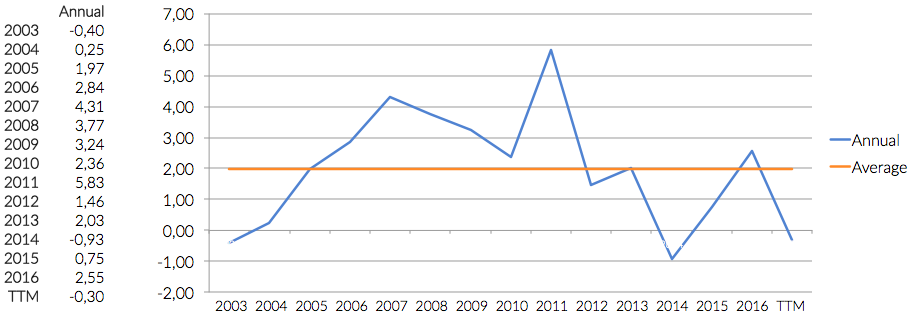
Now, compare those swings with that of the quote chart below. Not surprisingly, the earnings swings are reflected in the stock price’s swings.
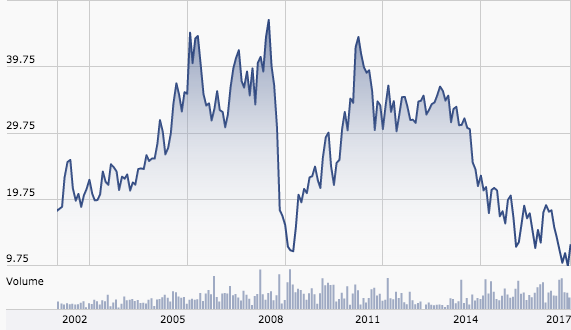
Let’s speculate that the industry will turn once again, hence inflating the earnings back to or above the average of $1.98. Say that the P/E multiple it trades at will hit its historic average of around 10-11, the stock should trade at $19.8-21,78. Hence, there’s an 62.5% upside as so forth this guess is somewhat accurate. This valuation hinges on guesswork, I’m not going to lie. Yet, I’m willing to bet that the industry is bound for an upswing, and that Rowan Companies’ strong financial position, cost-cutting initiatives and strategic relationships will ensure its survival until then.
Risks
Rowan Companies’ annual report outlines an array of risks thoroughly, so the reader should stop by said document. Yet, let’s highligt a few of the main risks. Obviously, the most impending risk is that the low demand and depressed day rates continue. If that happens, Rowan Companies may need to burn cash and stack up more of their assets in order to stay afloat. In addition, new rigs will enter the market in 2017 and 2020, so the market suffers from overcapacity, which puts further pressure on the day rates, though oil prices are the main driver of prosperity in the industry.
Conclusion: Why Rowan Companies, and not the competitors?
Now, when an industry is in a hole, the majority of the players in said market will be suffering alongside their stock prices. Hence, a lot of actors in the oil and gas drilling industry will appear cheap. So why am I betting on Rowan Companies, and not one of the other 14 players? Well, I like Rowan Companies’ qualitative aspects, e.g. their cost-cutting initiatives, their joint venture with a major player in the industry who happens to be a customer too (Saudi Aramco). Finally, Rowan Companies is one of the cheapest in the industry measured on an EV/EBITDA multiple (read about this multiple in The Little Book That Beats the Market and Deep Value). The majority is in the double digits and thus not attractively priced , but a handful are around 3-6, cf. the table below. As Seadrill Partners hasn’t existed long enough for me to consider it, and the others are not as qualitatively attractive, Rowan Companies is the horse I’m betting on, or the flower in the desert I’m trying to pick up, if you will.
| Company/stock | Cap. | Debt | Cash | EBITDA | EV/EBITDA |
| Seadrill Partners | $340 | $3,600 | $768 | $996 | 3.18 |
| Ensco | $1,680 | $5,275 | $2,602 | $764 | 5.70 |
| Rowan Companies | $1,660 | $2,680 | $1,145 | $553 | 5.78 |
| Atwood Companies | $749 | $1,227 | $145 | $297 | 6.16 |
| Diamond Offshoring | $2,003 | $2,085 | $156 | $579 | 6.79 |