This stock analysis of Charter Communications Inc. (CHTR) was inspired by episode 440 of The Investors Podcast where Stig interviewed Bryan Lawrence from Oakcliff Capital who – among other ideas and topics – discussed Charter Communications Inc. (CHTR) as a current investment opportunity. I got quite intrigued because of the “favorable industry structure” Bryan emphasised as well as Charter’s pricing power, which is crucial in times of high inflation. Hence, I decided to take a look for myself to understand the business more and conduct my own valuation.
Company Description
Charter is the product of a 2016 merger between Legacy Charter, Time Warner Cable and Bright House Network. It is the second-largest cable operator in the United States after Comcast.
According to its 2021 annual report, it offers internet, video, voice and mobile services under its Spectrum brand to +32 million customers (29,92 million residential customers, 2,154 business customers). Its networks can provide tv, internet and phone services to 54.5 million residents and business, which equates to around 40% of the country. Charter thus have a footprint penetration rate of 58.8%.
Charter offers high-speed internet of at least 200 Mbps (and up to 1,000 Mbps) in virtually all of its footprint as well as cable-television plus on-demand and pay-per-view. Increasingly, it is starting to offer mobile services, too, and is ramping up its efforts to get customers to bundle services, which is evident in the growth in mobile lines. The below matrix shows the split of customer relationships and revenues across the different services:
Revenue | Customer Relationships | Ave. Revenue Per Unit (ARPU) | Revenue Growth 2020-2021 | |
| Residential Internet | $21,094 billion | 28,137 million | $750 / $62.5 | 13.9% |
| Residential Video | $17,630 billion | 15,216 million | $1,160 / $96 | 1.1% |
| Residential Voice | $1,598 billion | 8,621 million | $185 / $15.4 | -11.5% |
| Commercial Solutions | $6,743 billion | 2,143 million | $3,174 / $262,5 | 4.9% |
| Mobile Lines | $2,178 billion | 3,448 million | $631 / $53.6 | 59.6% |
| Advertising Sales | $1,594 billion | N/A | N/A | -6.2% |
| Other | $845 million | N/A | N/A | 0.2% |
| Total Revenues | $51,682 billion | 32,069 million* | N/A | 7.5% |
As the table suggests, Charter’s internet and video offerings to SMBs and residential customers constitutes the core business, making up 88% of revenues. But, as mentioned above, Charter’s marketing and pricing strategy in which discounts are offered to those who bundle more Spectrum services seem to resonate with customers based on the growth of the mobile lines segment. The company expects to continue growing its customer relationships despite an expected decrease in its video and voice segments (both of which are in a secular decline since consumers move away from cable-tv and landlines).
The Industry
Charter is operating in an industry protected by a wide moat. Namely, it is a very capital-extensive industry to penetrate, as building out a cable or fiber network has start-up costs per customer of $2,000-$5,000 (source), excluding marketing, customer support and other costs to ensure sign-ups.
As a result, there are – as of now – few competitors. Charter and Comcast account for around 32 million customer relationships each followed by AT&T’s 15.4 million, Verizon’s 7.2 million and Cox’ 5.4 million; the rest are considered smaller players with 400,000-4,000,000 customer relationships (source).
Due to the little overlap in these competitors’ footprints, Charter is benefitting from either a local duopoly or monopoly. In ~66% of its footprint, there is no high-speed internet alternative*, and in most of the remaining ~34% there is a fiber provider to compete with. According to the 2021 annual report, Charter faces “.. terrestrial broadband Internet (defined as at least 25 Mbps) competition from three primary competitors, AT&T, Frontier and Verizon in approximately 34%, 9% and 5% of our operating areas, respectively.”
* “High speed alternative” is defined as a minimum of 25 Mbps. The tele communication companies are present in some of these areas, but their DSL offerings can in most cases not deliver more than 10 Mbps, which in today’s day and age falls short of most people’s needs.
The Stock (Ticker: CHTR)
The below chart shows the 5-year history of Charter Communications Inc. Class A (CHTR), which shows the stock has experienced three drawdowns in the period: The ~30% decline in 2018; the ~30% pandemic flash-crash of 2020; and the ~50% decline over the past 9 months.
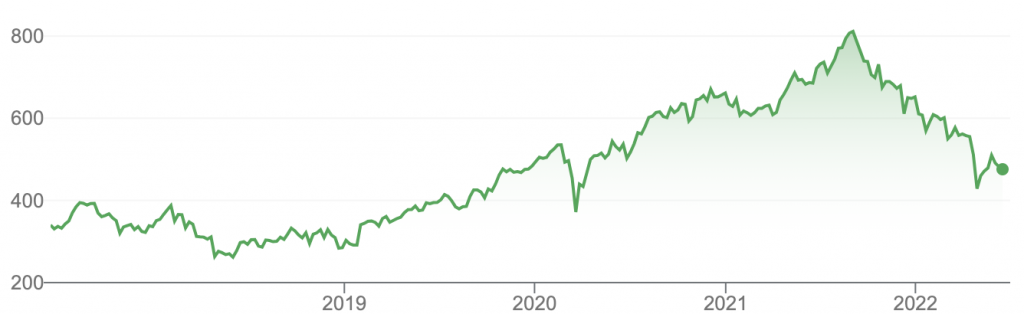
I started buying CHTR when it was trading at $442 in May 2022. Since then, it has started climbing a bit, and is now trading at around $475. At $475, it is still trading 42% below its all-time-high of September 2021 ($825). Before we go into the reasons for this recent decline, let’s turn back time to 2018.
In 2018, CHTR’s stock price declined around 30% between February and April. In an attempt to sell more smartphones, AT&T and Verizon started praising 5G to an extent where it claimed it could replace cable connections. Investors feared it would impact Charter’s profits, which caused the sell-off. With time, people (customers, investors as well as AT&T and Verizon) realised 5G couldn’t in fact compete with a cable or fiber connection when it comes to speed nor coverage. As investors realised this, the stock price recovered.
The reason I bring up the past is because we might be witnessing another ‘overreaction’. Lately, AT&T, Verizon and Google have announced intentions to start building out more fibered internet connections over the next 5-7 years. Fearful of the prospects of increased competition, investors started dumping their shares.
Opportunity or Threat?
In length of the previous section, Bryan Lawrence considers the current stock price to be an opportunity, as he believes there is a misconception as to what this ‘threat’ means for Charter. Oakcliff Capital’s analysis suggests that one of two scenarios will unfold:
- Scenario 1: AT&T, Verizon and Google do build/expand their fiber networks over the next 5-7 years to an extent that Charter will loose a fair share of their local monopolies, so the split between monopolistic and duopolistic DMAs (Designated Marketing Areas) will be 25-75%, respectively (compared to the current 65-35% split). According to Bryan – who studied Charter’s competitors’ prospectus to investors – AT&T, Verizon and Google would need to price their services at $75-$100 per month to earn an acceptable return on their investments. As I calculated in the matrix above, Charter’s average revenue per unit on its internet offerings is $62.5 a month. Charter can either decide to keep prices low and build upon their competitive advantage or increase their prices to match that of the competitors, which would positively and substantially impact its free cash flows as the networks’ costs are largely fixed. In fact, Bryan suggests this scenario to be the more favorable outcome because it would also mitigate the regulatory risk (a monopoly is more likely to be regulated than a duopoly is).
- Scenario 2: AT&T, Verizon and Google don’t build/expand their fiber networks, meaning Charter will keep its current 66-34% monopoly/duopoly footprint, and can pursue its strategy of driving customer growth within and beyond its footprint ‘unencumbered’ (or, as much as one can be left alone in this capitalistic world of ours).
Most likely, what will unfold is something in-between those two scenarios. I doubt AT&T, Verizon and Google will build their networks to the full extend they’ve projected, nor do I think they will disregard the projects all together. Regardless, it seems as if the prospects for Charter isn’t as bleak as the stock price currently suggests.
In terms of more traditional valuation metrics, the stock is now trading around a P/E of 17; P/S of 1.7 and P/CF of ~10. At the time of writing, CHTR has a market cap of $90.8b.
Management & Strategy
In this section, we will look at Charter’s management team and in extension the business’ historic performance, its growth strategy and the executives’ capabilities as operators and capital allocators. This discussion will inform the inputs we’ll use to value the business.
Management
The executive team of Charter has been working together for years. The CEO and Chairman of the Board, Thomas Rutledge, has been with Charter since 2012. The previous COO from 2012-2022, John Bickham, resigned in this capacity but is still a strategic advisor to the executive team through his new role as Vice Chairman of the Board. Following John Bickham’s resignation, Chris Winfrey was promoted to COO after having been the CFO since 2010. It is thus a tight-knit management team who has spearheaded the double-digit growth Charter has demonstrated since 2016.
I believe this management team has also earned the title as ‘owner operators’, evident in its large equity holdings in the company – Mr. Rutledge’s $70.7 million, Mr. Winfrey’s $80.7 million, and Mr. Bickham’s $13.5 million – as well as their stance on capital allocation. Charter has retired more than 100 million shares, or 35%, since 2017 (from 296.70 million to 193.04 million shares outstanding), which equates to 10.2% on a CAGR basis. Speaking of, Charter bought back $3.6b worth of stock in Q1 2022 alone (6 million shares), which – to me – indicates management likely regard CHTR to be undervalued at current levels.
Performance
By looking at Charter’s 2017-2021 performance, the most notable achievement is management’s ability to grow the business’ net income and free cash flows by 46.4% and 20.7% per annum, respectively. Mixed with management’s aggressive attitude towards share buybacks, we arrive at some lofty per-share growth rates of 63.1% and 34.4%. In my opinion, these figures underscore why the management team is considered “the best in the business”.
| Revenue | Gross Profit | Net Income | FCF | EPS | FCF/Share | |
| 2017 | $41.58b | $17.46b | $1.028b* | $4.093b | $3.46* | $13.79 |
| 2018 | $43.63b | $18.82b | $1.23b | $2.172b | $5.22 | $9.22 |
| 2019 | $45.76b | $19.58b | $1.67b | $4.608b | $7.45 | $20.59 |
| 2020 | $48.10b | $21.20b | $3.22b | $7,070b | $15.40 | $33.78 |
| 2021 | $51.68b | $23.27b | $4.72b | $8.684b | $24.47 | $44.98 |
| CAGR | 5.59% | 7.45% | 46.38%** | 20.69% | 63.08% | 34.39% |
* I used the pro forma $1.028b number rather than the actual/reported $9.9 billion net income figure, as “the increase was primarily driven by a non-cash GAAP tax benefit of $9.3 billion from a reduction in the deferred tax liability as a result of the enactment of the Tax Cuts and Jobs Act (“Federal tax reform”) in order to measure ‘actual’ operating performance.
** Note that Charter’s net income has been positively affected by the $10.9 billion net operating loss carry-forwards “resulted from the operations of Charter Communications Holdings Company, LLC (“Charter Holdco”) and its subsidiaries and from loss carryforwards received as a result of the TWC Transaction”. As of 2021, only $714 million of NOL remains, meaning Charter will be a subject to tax payments of 21%.
Strategy
According to the latest annual report, management expects its television and voice services to decrease in both customer relationships and revenues, as both of those are in a secular decline. However, management expects its internet and mobile offerings to continue its growth trajectory.
Footprint Penetration
As mentioned previously, Charter’s 2021 footprint is 54.5 million homes and businesses of which it services 32 million, which equates to a 58.8% penetration rate. That is up from 45% in 2017, which equates to a 6.9% compounded annual growth rate (CAGR).
If Charter manages to increase the penetration rate by continuing to take market share from telcos or increase its ARPU – e.g. through upselling more services through their bundling discounts, or by raising prices (Comcast’s ARPU is $159.22 compared to Charter’s $113.61, so theoretically there should be room to pursue that tactic) – it will of course positively impact the growth rate. Currently, 46.7% of Charter’s customers subscribe to one service, 33% subscribe to two, and 20.4% to three.
In length, there is room to grow through footprint penetration, as ‘only’ 53.4% subscribe to a bundle of services.
Network Expansion
The other leg of Charter’s growth strategy is network expansion. It is looking to add 100,000 miles to its existing 800,000 miles network over the next five years, which management estimates will add 1 million customers. Assuming all of these customers are residential, as it aims to deliver broadband to “unserved rural customer locations”, it’ll add $1.36b to Charter’s top-line in 2026 (1.000.000 x (113,61 x 12)).
Mobile Lines
‘Spectrum Mobile’ is a service offered exclusively to customers subscribing to Charter’s fixed internet service. It runs on Verizon’s network combined with its own Spectrum WiFi network. In October 2021, Charter implemented a discount programme which ensures lower prices for customers with two or more mobile lines. As previously stated, these bundle discounts seem to resonate with consumers and is a deliberate tactic on Charter’s behalf, cf. p. 28 of the annual report:
“We remain focused on driving customer relationship growth by deploying superior products and services with attractive pricing. In October 2021, we announced and implemented new Spectrum Mobile multi-line pricing designed to drive more mobile line sales per customer, and in turn, drive more broadband sales and the associated retention benefits. Further, we expect to continue to drive customer relationship growth through sales of Internet connectivity services and improving customer retention. […] We believe Spectrum-branded mobile services will drive higher sales of our core products, create longer customer lives and increase profitability and cash flow over time.”
At the moment, the mobile lines product line is negatively impacting Charter’s free cash flows because of the costs associated with getting this service rolled-out (such as the licensing agreement with Verizon as well training, sales, marketing and customer support). According to the annual report, it reduced FCF by $1.1b and $853m in 2020 and 2021, respectively. Though $853m equals a 9% negative impact on Charter’s 2021 FCF of $8.629b, I consider it an exciting growth opportunity that I currently don’t put a value on, but one I would watch closely.
Intrinsic Value of Charter Communications Inc.
Unlike my previous analyses’ reliance on the Discounted Cash Flow (DCF) model, the intrinsic value estimate of CHTR will be based on a P/CF multiple valuation. P/CF (price-to-free-cash-flow) is the cable industry’s standard valuation metric (rather than P/E) because of the significant non-cash depreciation and amortisation expense that results from the capital-intensive nature of the business. Free cash flow (FCF) is the proceeds after capital expenditures needed to maintain the operational assets. It represents the cash that management has available to reinvest into the business, pay out dividends or buy back shares.
Below is an outline of the assumptions I’ve applied in my intrinsic value estimate:
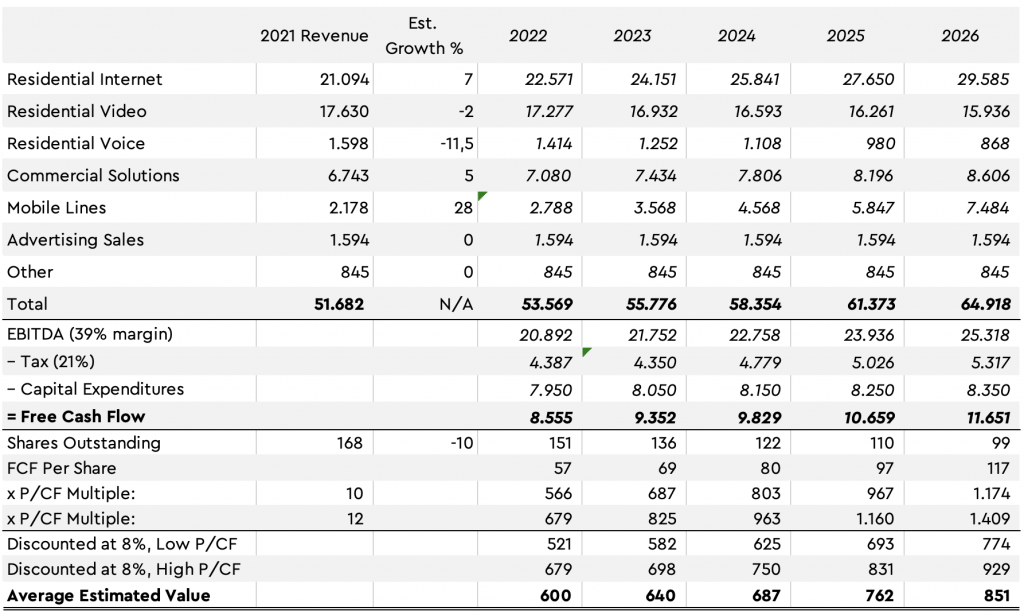
- Residential Internet: To be cautious, I’ve applied a 7% growth rate to this segment, which is half the 2020-2021 growth rate (see table above). I expect this to be achieved through a mix of increased footprint penetration (via bundling discounts and/or price increases) and network expansion.
- Residential Video & Voice: Because of the secular decline of both cable tv and landline phones, I predict that these segments will continue its negative growth. I’ve applied the 5-year CAGR of -2% for video and the current -11.5% for voice. Charter currently tries to offset the declining user base via price increases, but to err on the side of conservatism, I do not factor those price increases into my valuation, nor do I assume the 2020-2021 increase in video is a ‘new normal’.
- Mobile: Based on projections that Charter’s mobile segment will reach $5.85b in revenues by 2025, I have applied a growth rate that’ll achieve just that: 28% (which is less than half the 2020-2021 growth of 59.6% cf. the table above).
- Commercial, Advertising & Other: For these segments, I have applied a 5%, 0% and 0% growth rates, respectively, based on recent historic performance.
- EBITDA Margin: Though Charter’s EBITDA margin increases steadily from quarter to quarter, I have applied the current margin of 39% throughout all five years.
- Tax: As Charter’s NOL is effectively depleted, the company is now subject to paying taxes of 21%.
- Capital Expenditures: For 2022, I used management’s $7.2b estimate (which excludes the network expansion costs). I have assumed the $3.8b cost of for the network expansion project will be distributed evenly ($750m per annum) throughout the period. Hence, for 2022, I have assumed CapEx expenses of $7.95b. Based on the consistency in Charter’s CapEx, I consider the 2022 numbers ‘the base’ upon which I add an additional $100m per year to account for the growing number of customer relationships.
- Shares Outstanding: Based on the recent share buybacks and management’s shareholder friendly attitude, I expect Charter to continue retiring shares at a pace of 10% per annum.
- P/CF Multiples: I have applied a 10 and 12 multiple on the FCF per share, which is below the index’ 5-year average of 15, but within the range that Charter has historically traded.
- Discount Rate: As Charter is heavily levered with its $91b debt burden, it means a relatively low WACC because of the average interest rate of 4.6% (3.2% after taxes) and its debt/equity ratio of 7.5. For the equity piece, I have applied a 9% rate on top of the risk-free-rate of 3%, so the WACC comes out at 8% (source).
Based on these assumptions, I estimate Charter to be valued at $774-$929 per share in 2026. Averaging that span at $851 indicates a ~80% upside from today’s price.
Risks
Debt Burden
As mentioned throughout this write-up, Charter has a substantial debt burden of $91.2b of which 13% is subject to variable interest rates. I am usually not a fan of highly levered companies, but due to the stability of Charter’s operating model, its consistency in free cash flows, the pricing power it enjoys thanks to its competitive pricing and the fact that Charter’s services can be (in my opinion) ranked alongside utilities dampen my concerns.
Fiber Build-Out
The fiber build-out mentioned earlier in this write-up is a valid concern. It is worth keeping an eye on, but I still believe evidence suggests that it is a difficult industry to penetrate. For instance, Verizon spent $25b on building a network that should bring internet to 18 million homes. It was, however, winded down since it wasn’t economically viable.
Loss of Video Subscribers
As highlighted earlier, cable TV is in a secular decline as more people are replacing it with one or more streaming services. Though its residential video customer relationships grew 1.1% between 2020 and 2021, its current customers of 15.2m is down from 16.5m in 2017, or a 2% decline per annum. As each customer represents $1,160 in annual ARPU, it is not just chum chains, though it is the least profitable of Charter’s segments because of the high programming costs. So far, that decline has been more than offset in the growth of internet (and mobile) customer relationships.
Technological Risk
The industry inherently have technological risks, e.g. if new, better or cheaper ways to supply internet, video and mobile services emerge, it puts Charter at risk. While the concerns of 5G replacing fixed internet connections didn’t prove to be a real competitive threat, it serves as an example of the type of technological risk that can impact Charter’s business – or its stock price (whether it be for valid reasons or not).
Regulation
As the industry is marked by local monopolies and duopolies, it is facing the risk of regulation. If the FCC decides to categorise broadband as a utility and gets the power to set rates, it will weakens Charter’s pricing power and potentially slow down revenue growth.
Conclusion
In short, I am bullish on Charter Communications Inc. (CHTR). I believe it’s a wide-moat business thanks to the industry structure in which Charter has positioned itself favourably as the ‘one-stop-shop’, lower cost alternative.
I echo Bryan Lawrence’s notion that the recent stock price drawdown of 50% represents a misconception about the competitive threat of AT&T, Verizon and Google’s fiber build-out plans. Though I do expect increased competition as a result, it seems unlikely that it will impact Charter’s profitability.
The current stock price of $475 is suggesting Mr. Market regards the business as a slow-grower, which stands in deep contrast to Charter’s double-digit FCF and net income growth. On a per-share basis, the growth is even more remarkable because of Charter’s substantial share buybacks.
I estimate Charter’s intrinsic value to be in the neighbourhood of $850, which represents an 80% upside potential from today’s price.